# qAOP App: Predicting Key Events and Adverse Outcomes Over Time
**Filippo Di Tillio**
The qAOP App offers an integrated overview and time-course predictions of *key events* (KEs) and *adverse outcomes* (AOs) derived from ODE-based quantitative AOPs (qAOPs) developed for the cisplatin-induced nephrotoxicity case study. These models were calibrated using both in vitro and in vivo time-course datasets.
For the in vitro component, RPTEC/TERT1 cells were exposed to cisplatin concentrations ranging from 1 to 50 µM over a 72-hour period. Gene expression changes and the percentage of propidium iodide (PI)-stained cells were quantified as indicators of cellular response.
The in vivo dataset consists of transcriptomic and histopathological measurements from rat kidneys following a 5 mg/kg intravenous dose of cisplatin over a timespan of 28 days. Transcriptomic profiling specifically targeted the outer medulla of the proximal tubule.
Transcriptomic data were translated into quantitative KE measurements using the TXG-MAPr platform. Specifically, TXG-MAPr was employed to quantify the *DNA Damage* KE in both in vitro and in vivo datasets, while *Inflammation* was quantified exclusively in the in vivo setting.
## Model Selection and Inputs
The app’s initial interface allows users to select a model and specify the dose and time point of interest (Figure 1). A brief description accompanies each model, explaining how the underlying data were generated. Default values are automatically provided based on the selected model. For dose, the defaults are set to the highest tested concentration in vitro (50 µM) and the single administered dose in vivo (5 mg/kg). The default time points correspond to the full simulation windows: 72 hours for the in vitro model and 672 hours for the in vivo model. Users can input any desired dose and time point. However, it is recommended to keep in vivo doses within the range of 0 to 10 mg/kg, as higher doses may yield less reliable predictions.
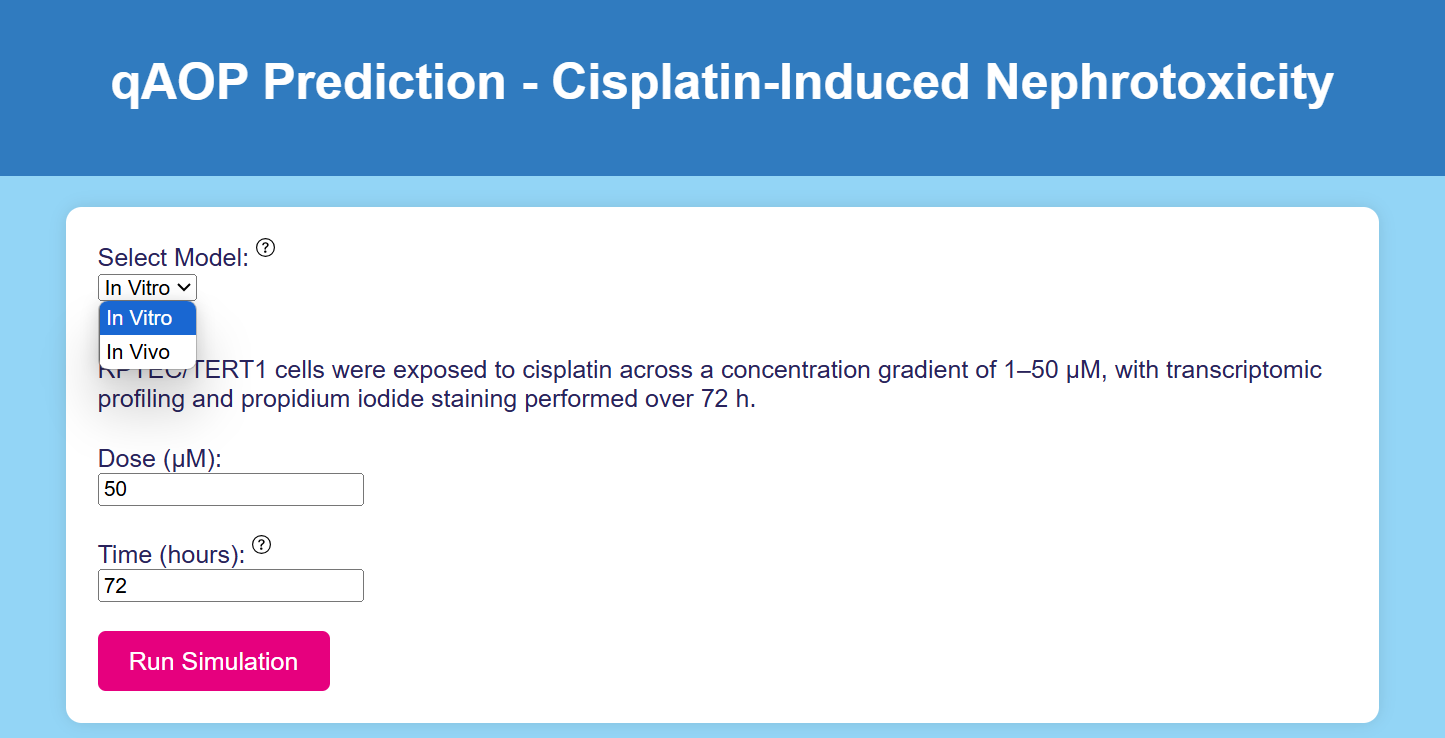 *Figure 1: User Interface of the qAOP App. The user can select between in vitro and in vivo models and input the desired dose and simulation time.*
## Run Simulation
Once the model, dose, and time point are selected, the user can initiate the simulation by clicking the *Run Simulation* button. This triggers the execution of the ODE system corresponding to the selected model and generates time-course predictions for each KE in the qAOP. The output reflects the system’s response to the specified dose, with the simulation time frame extending up to the user-defined time point (Figure 2). For the in vitro model, the plotted KEs include *DNA Damage* and *Necrosis*, while the in vivo model additionally includes *Inflammation* and *Fibrosis*. Alongside the time-course plots, the app also provides a snapshot of the KE and AO levels at the selected time point, displayed as a distribution across all elements of the AOP (Figure 3).
*Figure 1: User Interface of the qAOP App. The user can select between in vitro and in vivo models and input the desired dose and simulation time.*
## Run Simulation
Once the model, dose, and time point are selected, the user can initiate the simulation by clicking the *Run Simulation* button. This triggers the execution of the ODE system corresponding to the selected model and generates time-course predictions for each KE in the qAOP. The output reflects the system’s response to the specified dose, with the simulation time frame extending up to the user-defined time point (Figure 2). For the in vitro model, the plotted KEs include *DNA Damage* and *Necrosis*, while the in vivo model additionally includes *Inflammation* and *Fibrosis*. Alongside the time-course plots, the app also provides a snapshot of the KE and AO levels at the selected time point, displayed as a distribution across all elements of the AOP (Figure 3).
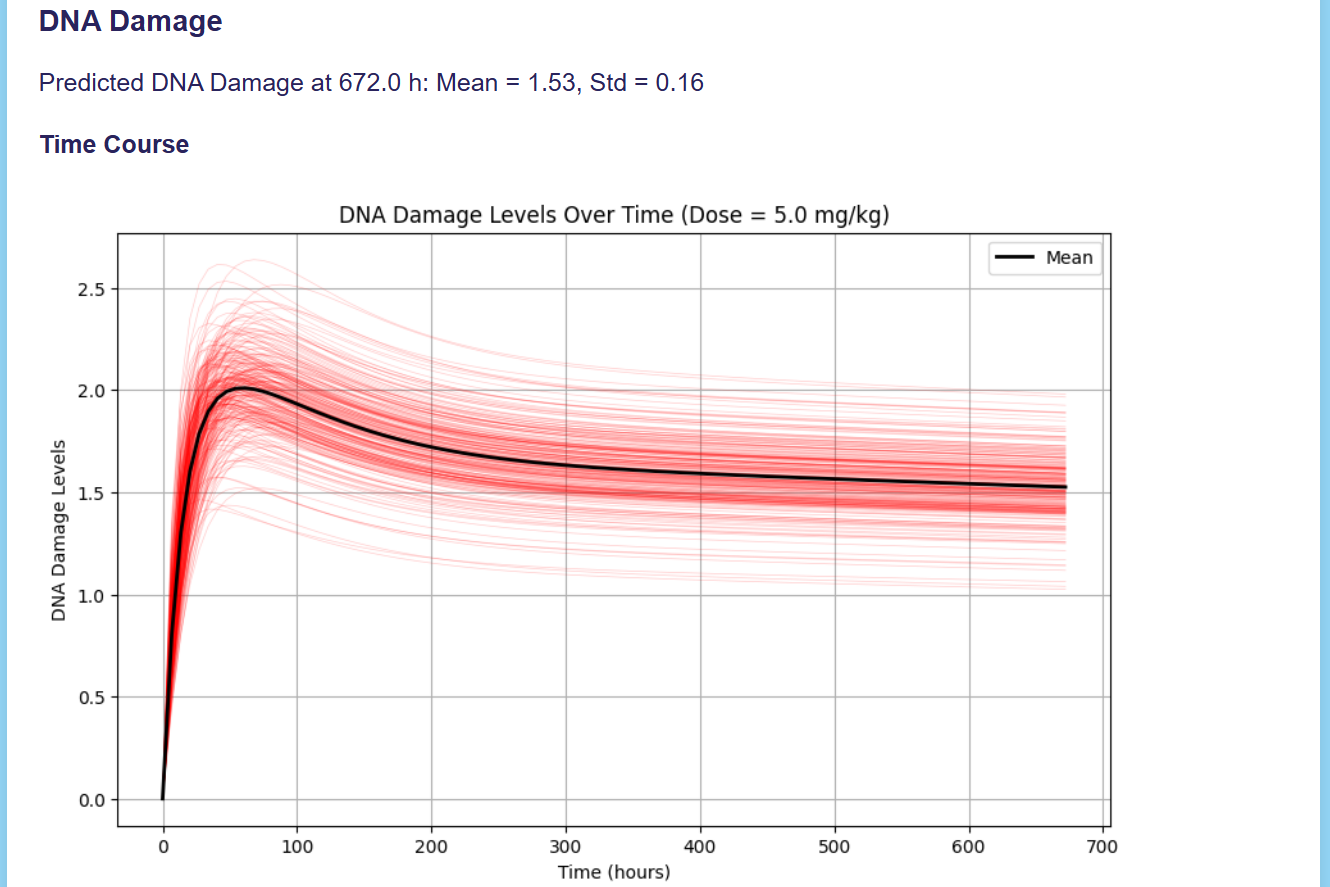 *Figure 2: Time-Course Simulation of DNA Damage in the In Vivo Model. Default values for Dose and Time are used.*
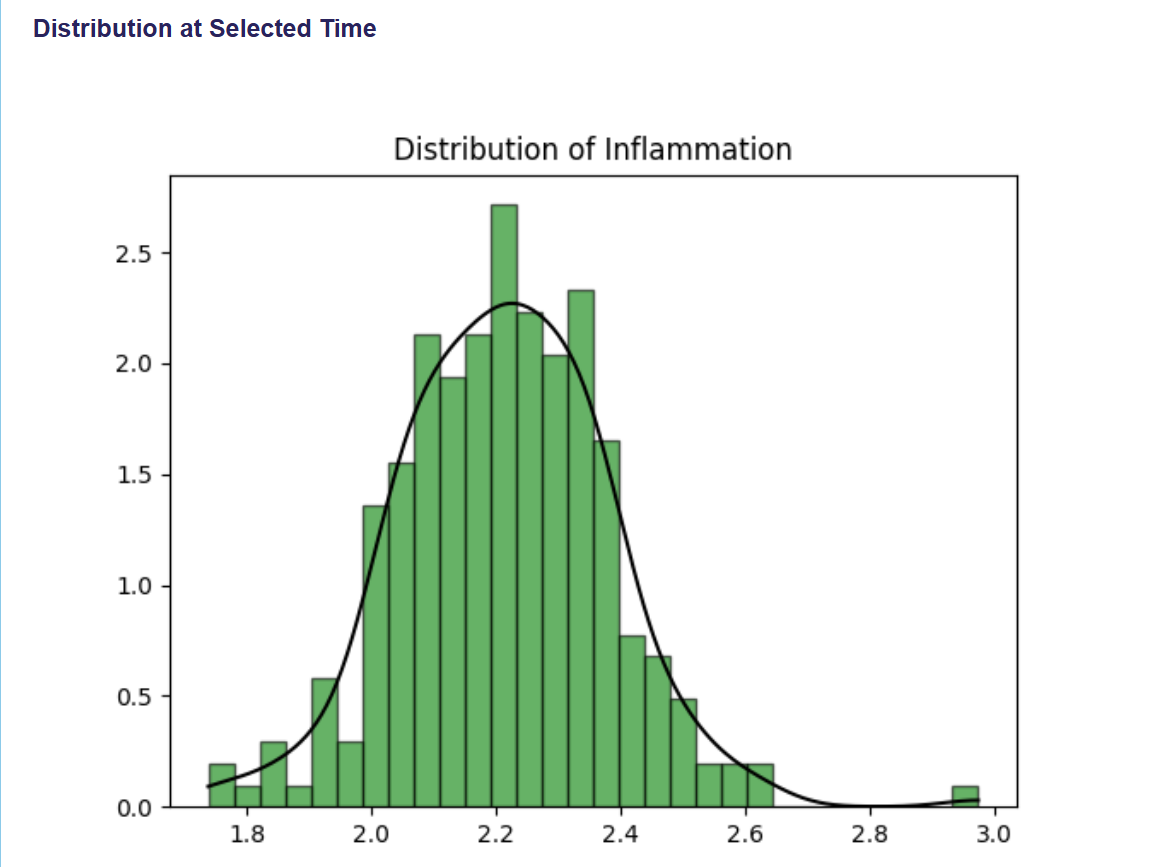 *Figure 3: Distribution of Inflammation Levels at 672h.*